
 Disclaimer
Microsoft Power BI


Information
- Category: Business
- Price: free
- Age Rating: Everyone
- Rating: 4.6
- Developer: Microsoft Corporation
- Version: 2.2.260114.21286639


Microsoft Power BI is a powerful business analytics tool that enables users to visualize data and share insights across their organization. With its intuitive interface, users can create interactive reports and dashboards, transforming raw data into meaningful information. Power BI integrates seamlessly with various data sources, allowing for real-time analysis and collaboration. Whether for small businesses or large enterprises, it empowers decision-makers to make informed choices based on data-driven insights.
Features of Microsoft Power BI
Microsoft Power BI is a powerful business analytics tool that provides a range of features designed to help users visualize data and share insights across their organization. One of its key features is the ability to connect to a wide variety of data sources, including cloud-based and on-premises databases, Excel spreadsheets, and web services. This flexibility allows users to aggregate data from multiple sources for comprehensive analysis.
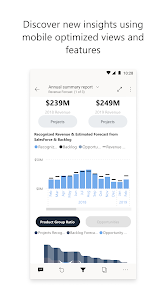
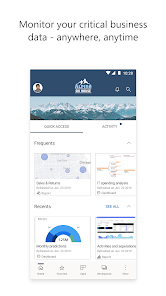
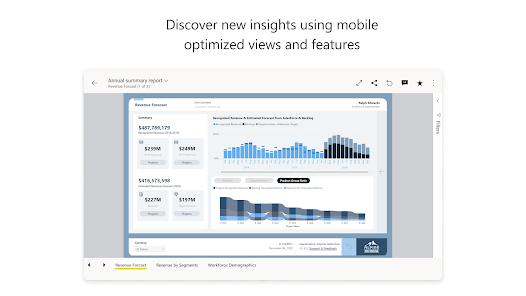
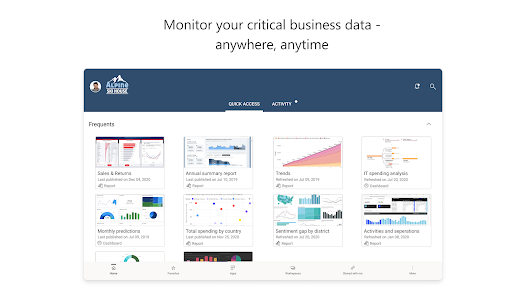
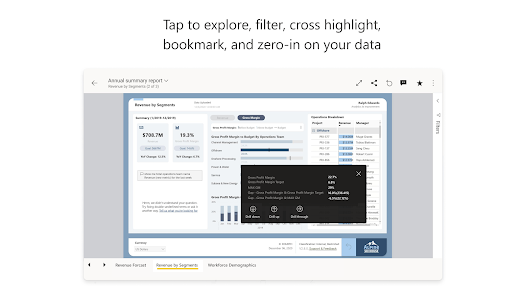
Another notable feature is the interactive dashboards that enable users to create visually appealing reports with drag-and-drop functionality. These dashboards can be customized to display key performance indicators (KPIs) and other metrics in real-time. Additionally, Power BI offers advanced data modeling capabilities, allowing users to create complex calculations and relationships between different data sets.
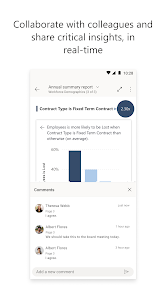
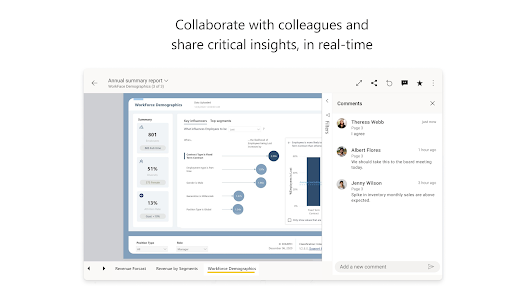
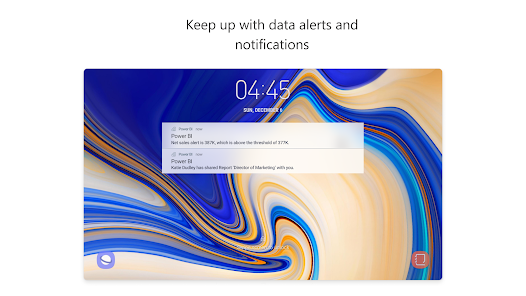
Power BI also supports natural language queries, enabling users to ask questions about their data in plain English and receive instant visualizations. Furthermore, the tool provides robust sharing and collaboration options, allowing teams to work together on reports and dashboards. With regular updates and a strong community, Power BI continues to evolve, offering new features and enhancements to meet the needs of its users.
How to Use Microsoft Power BI
Using Microsoft Power BI involves several key steps that enable users to transform raw data into meaningful insights. First, users need to download and install the Power BI Desktop application, which serves as the primary interface for creating reports and dashboards. Once installed, users can connect to various data sources by selecting the "Get Data" option, allowing them to import data from databases, Excel files, or online services.
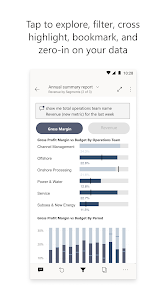
After importing data, users can begin the data transformation process using Power Query, which allows for cleaning and shaping the data to meet specific analysis needs. Once the data is prepared, users can create visualizations by dragging and dropping fields onto the report canvas. Power BI offers a variety of visualization options, including charts, graphs, and maps, which can be customized to enhance clarity and impact.
Once the report is complete, users can publish it to the Power BI service, where it can be shared with others in the organization. Collaboration features enable team members to comment on reports and dashboards, fostering a data-driven culture. Additionally, users can set up scheduled data refreshes to ensure that their reports always reflect the most current information, making Power BI a dynamic tool for ongoing analysis.
Pros & Cons of Microsoft Power BI
Microsoft Power BI offers several advantages that make it a popular choice for businesses seeking data analytics solutions. One of the primary pros is its user-friendly interface, which allows users with varying levels of technical expertise to create reports and dashboards easily. The ability to connect to numerous data sources enhances its versatility, enabling organizations to consolidate data from different platforms for comprehensive analysis.
Another significant advantage is the cost-effectiveness of Power BI, particularly for small to medium-sized businesses. The pricing model is competitive, with a free version available that provides essential features, while the Pro version offers advanced capabilities at a reasonable cost. Additionally, Power BI's integration with other Microsoft products, such as Excel and Azure, streamlines workflows and enhances productivity.
FAQ
Can I create playlists on Spotify?
Yes, users can create, share, and collaborate on playlists with friends.
Can I download music on Spotify?
Yes, premium users can download songs and playlists for offline listening.
Can I listen to Spotify offline?
Yes, premium users can listen to downloaded music offline without an internet connection.
Can I use Spotify on multiple devices?
Yes, you can use Spotify on multiple devices, but only one device can stream at a time.
Does Spotify have podcasts?
Yes, Spotify hosts a wide range of podcasts across various genres.
Similar Apps


You May Like

ADP Mobile Solutions
Business
4.5

Joist Invoices for Contractors
Business
4.7

DoorDash - Dasher
Business
4.2

Duo Mobile
Business
4.5

Google Chat
Business
4.4

Indeed Job Search
Business
4.7

Invoice Maker - InvoiceBase
Business
4.9

LinkedIn: Jobs & Business News
Business
4.1

Microsoft Authenticator
Business
4.7

Microsoft Teams
Business
4.7

Intuit QuickBooks for Business
Business
4.7

Uber - Driver: Drive & Deliver
Business
4.6